Scoring Details & Numerical Values
In addition to providing intuitive letter grades for each of the six subjects, Waterworks Excellence makes the underlying assumptions and logic for the grading rubric easily accessible to anyone interested. Users may drill down to view a detailed breakdown of the numerical values that comprise each score. Following are some examples from 2024 Waterworks Excellence report cards.

HEALTH
Numerical contaminant scores. The WE grading scheme views compliance with Maximum Contaminant Levels (MCLs) and action levels as defined in state and federal rules as a minimum expectation. Put another way, MCL compliance alone will earn a utility merely passing marks. Achieving excellence in water quality means providing water with contaminants well below MCLs.
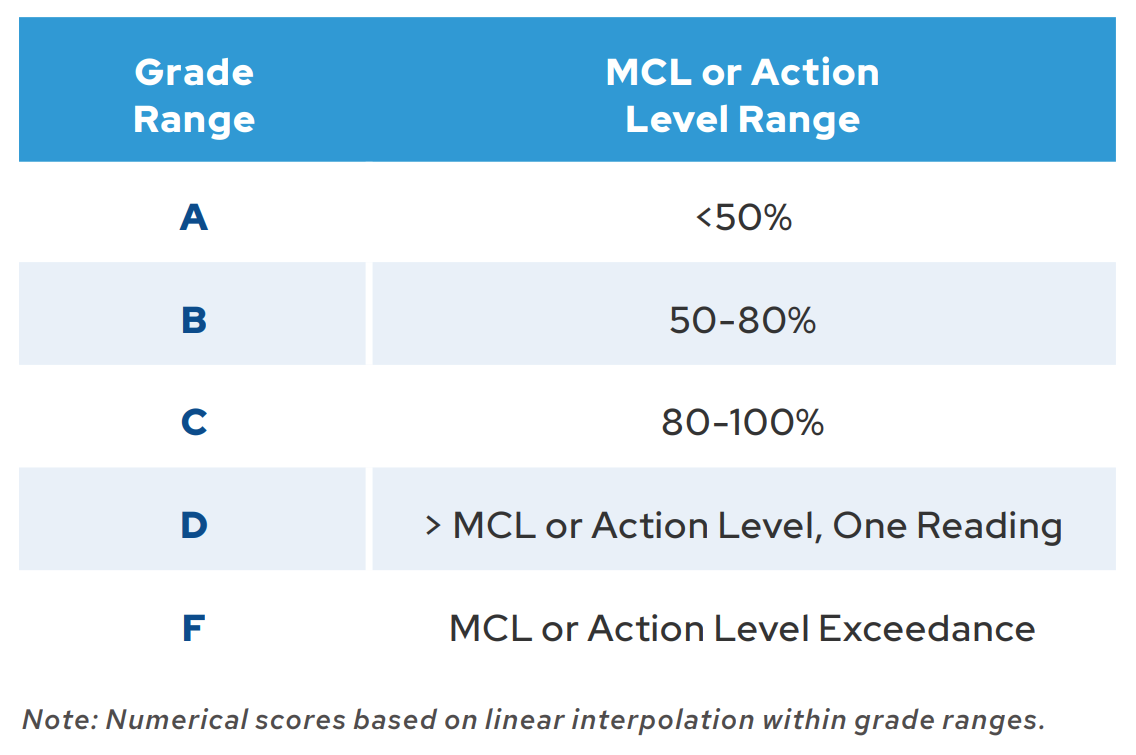
To that end, we created a scale that calculated grades as a function of the maximum contaminant level observed each year relative to each contaminant’s MCL. Utilities received “A” grades for contaminant readings ranging from 0% - 50% of MCL, “B” grades ranging from 50-80% of MCL, “C” grades ranging from 80-100% of MCL, and “D” grades for one reading exceeding the MCL. Utilities received an “F” or failing grade if they received a MCL or Treatment Technique (TT) violation in 2022 or 2023. Table 1 summarizes this rubric.
Table 1: Health grading rubric based on SDWA Maximum Contaminant Limits
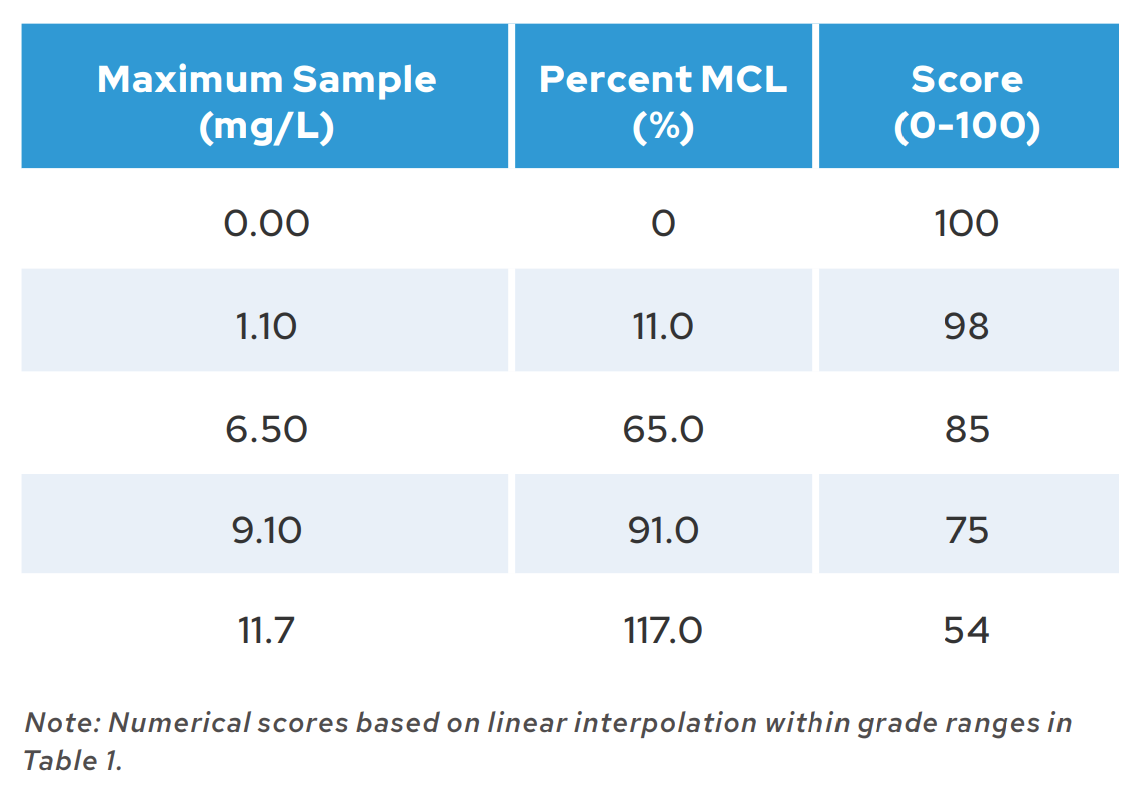
A corresponding 0-100 numerical grading scale applies to each contaminant using linear interpolation. For example, a sampled contaminant value of zero is scored as 100, while a sample at 50% of the MCL for that contaminant scores 90; a sample at 51% of the MCL would score 89, while a sample at 80% of the MCL would score 80, and so on. Table 2 offers an illustration of this scoring system for Nitrate, one of the acute contaminants, with five hypothetical contaminant levels and their respective numerical scores
Table 2: Illustrative example of contaminant level grading - Nitrate

AESTHETICS
Scoring for secondary contaminants followed a methodology similar to our scoring for Health: utilities earn grades by maintaining secondary contaminant levels relative to SMCLs. WE scores for Aesthetics are based on average sampled contaminant levels, rather than the maximum samples that we used to score Quality-Health. We used the rubric in Table 3 to score iron, manganese, chloride, sulfate, aluminum, and fluoride. We applied a separate rubric to alkalinity and hardness (discussed further in full report).
Table 3 - Aesthetics scroing based on SDWA Secondary MCLs
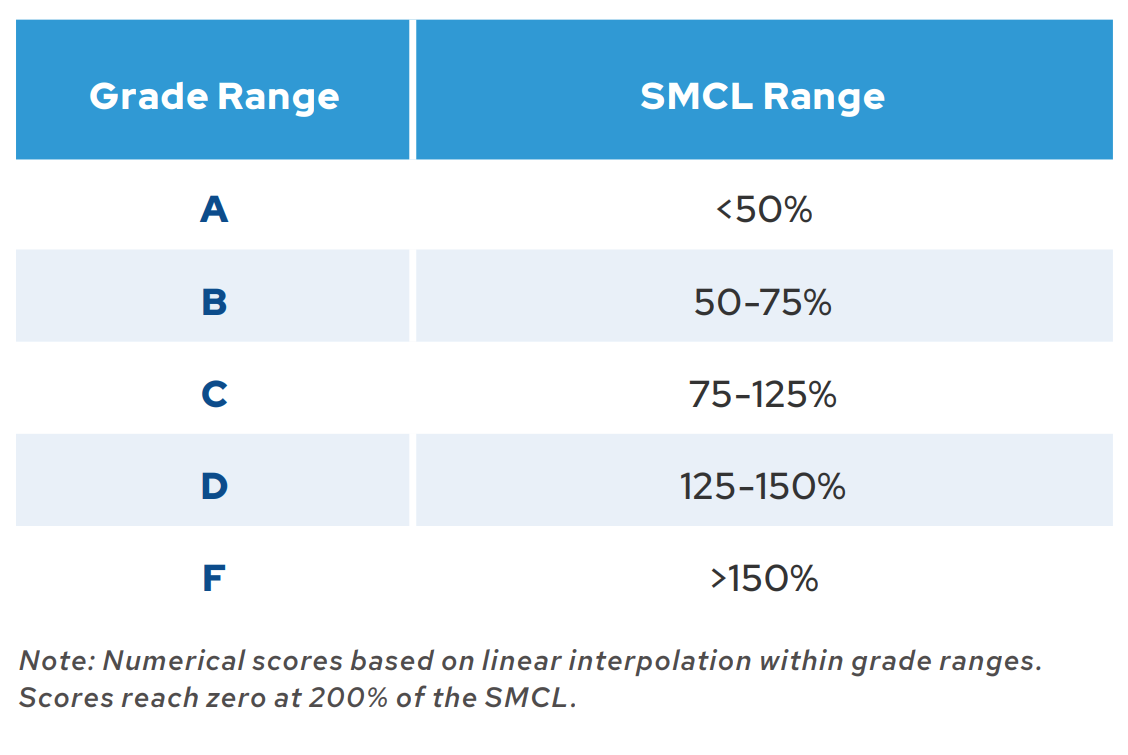
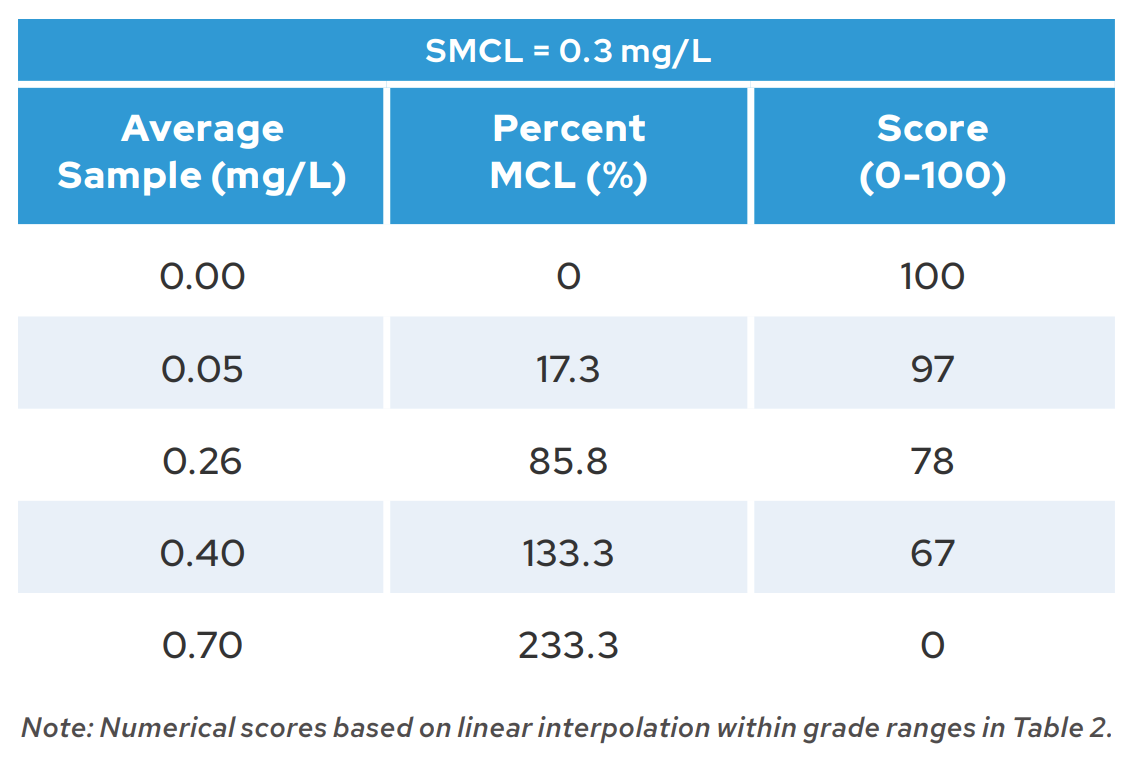
Once again, a corresponding 0-100 numerical grading scale applies to each secondary contaminant using linear interpolation. For example, a sampled contaminant value of zero is scored as 100, while a sample at 50% of the SMCL for that contaminant scores 90; a sample at 51% of the MCL would score 89, while a sample at 75% of the MCL would score 80, and so on. Scores “zero out” at 200% of the SMCL. Table 4 offers an illustration of this scoring system for Iron, with five hypothetical contaminant levels and their respective numerical scores.
Table 4 - Illustrative example of secondary contaminant level grading - Iron
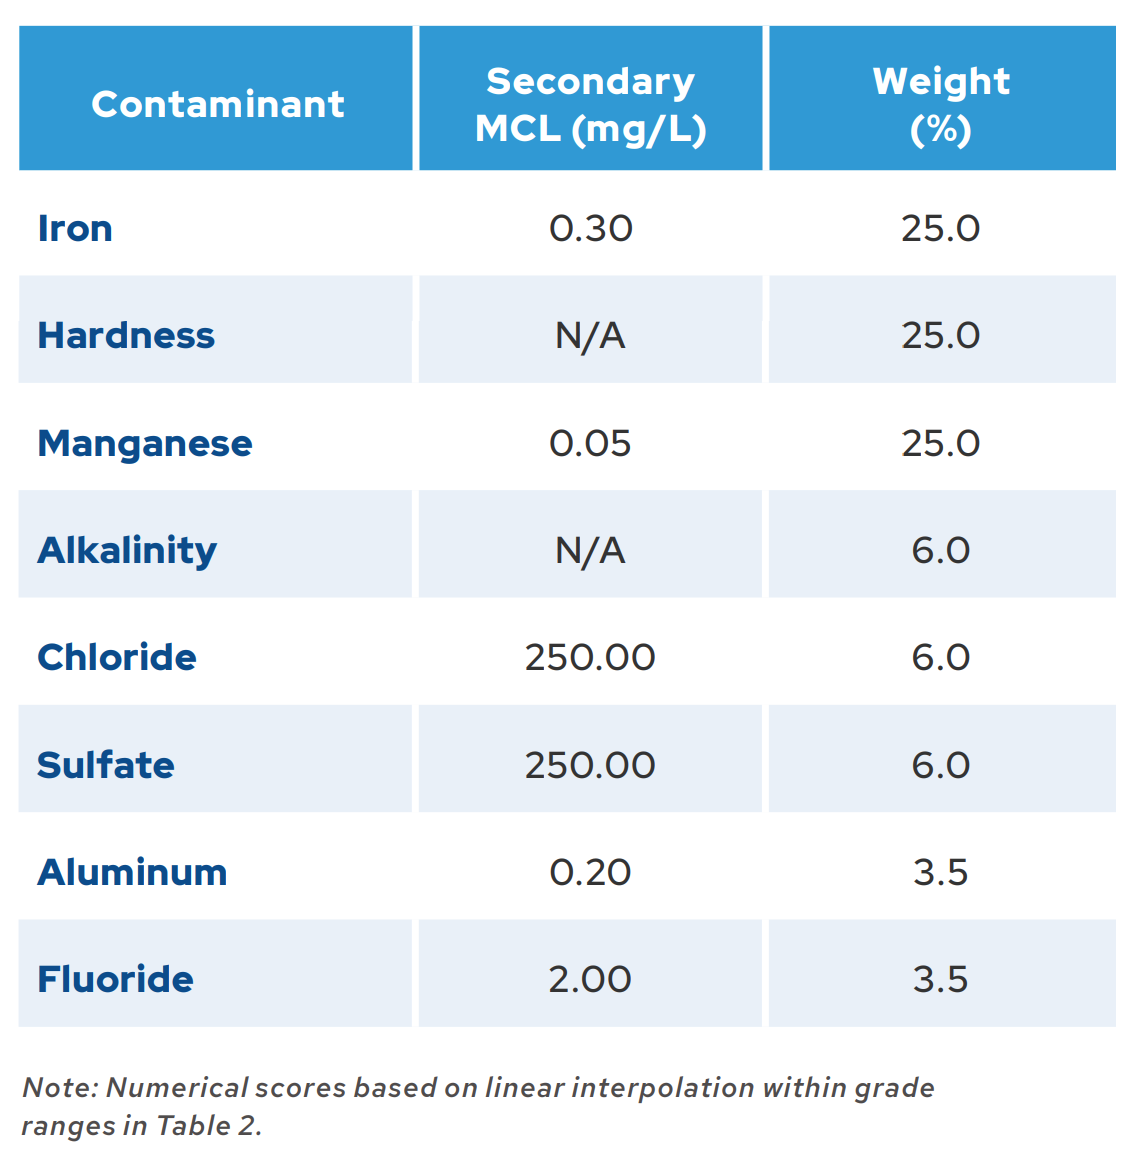
Aesthetics grades weigh secondary contaminants more or less heavily depending on their relative impact on aesthetics. Iron, manganese, and hardness are most heavily weighted, contributing 25.0% each to the total grade. Alkalinity, Chloride, and Sulfate scores account for 6.0% each, with Aluminum and Fluoride each weighed at 3.5%. Table 5 summarizes these weights
Table 5 - Secondary contaminant weighting for Aesthetics grades
